
Vybe Legacy
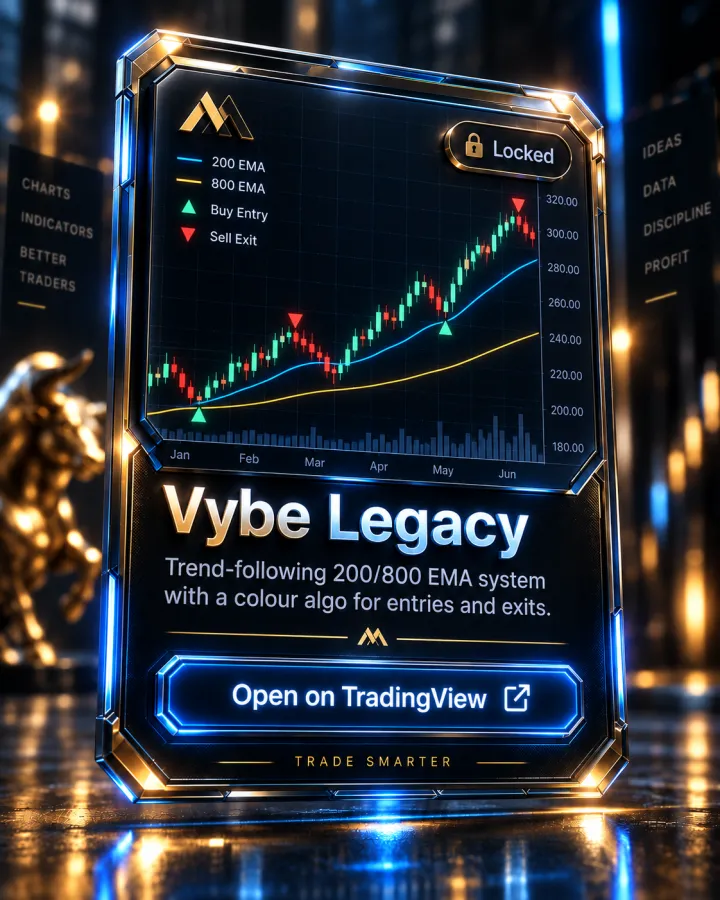
Trend-following 200/800 EMA system with a colour algo for entries and exits.
What it shows
Vybe Legacy is a trend-following system built on three EMAs — 200, 800, and a 50 EMA with a built-in trend-changing algorithm — plus color-coded buy/sell signals and TradingView alert support. Per the author's own description, the recommended read is to buy when the 50 EMA trend indicator, the 200 EMA and the 800 EMA all plot below price (bullish), and to sell when all three plot above price (bearish), following the trend-changer color to filter out noise. The author recommends backtesting before trading it live.
How it's used in the MTM method
This is named directly in the Academy curriculum: the TDI & Indicators module's final lesson is titled "Vybe Legacy Indicators" — setup, alerts and usage. Its 200 and 800 EMAs are the same White and Blue lines from the EMA Technical Analysis module, and the 800 EMA read lines up with the "Blue Waves" lesson in Risk Management, which teaches reading the 800 EMA's wave structure for macro trend context.
Key features
- 200 EMA, 800 EMA, and a 50 EMA with a built-in trend-changing algorithm
- Color-coded buy/sell signals
- TradingView alert support
- Recommended read: all three plot below price for buys, all three above for sells
Pairs with
How access works
- This indicator is invite-only on TradingView. Access is granted automatically to your TradingView username after you join the Academy — usually within minutes.
- Open the Vybe Legacy script page on TradingView and click "Add to favorite indicators."
- On any chart, open Indicators (the "/" key) → Favorites, and it's there. It's also listed under your Invite-only scripts.
Vybe Legacy is included with every Academy plan — not sold separately
Full Academy access starts at $499, one-time, not a subscription. See full pricing.
FAQ
Is Vybe Legacy named in the curriculum?
Yes — it's the final lesson of the TDI & Indicators module, covering setup, alerts and usage directly.
What's the basic read?
Per the author's own description: buy when the 50 EMA trend indicator, 200 EMA and 800 EMA all plot below price; sell when all three plot above price, following the trend-changer color to reduce noise.
Should I trade it live right away?
The author's own guidance is to backtest first — the same discipline the Academy's Risk Management module teaches before sizing into any new setup.
More questions answered on the full FAQ page.
See the rest of the toolkit on the TradingView Indicators page.
Trading forex and futures involves substantial risk of loss and is not suitable for every investor. Nothing on this page is investment advice. Read the full risk disclosure.