
Vybe Indicator
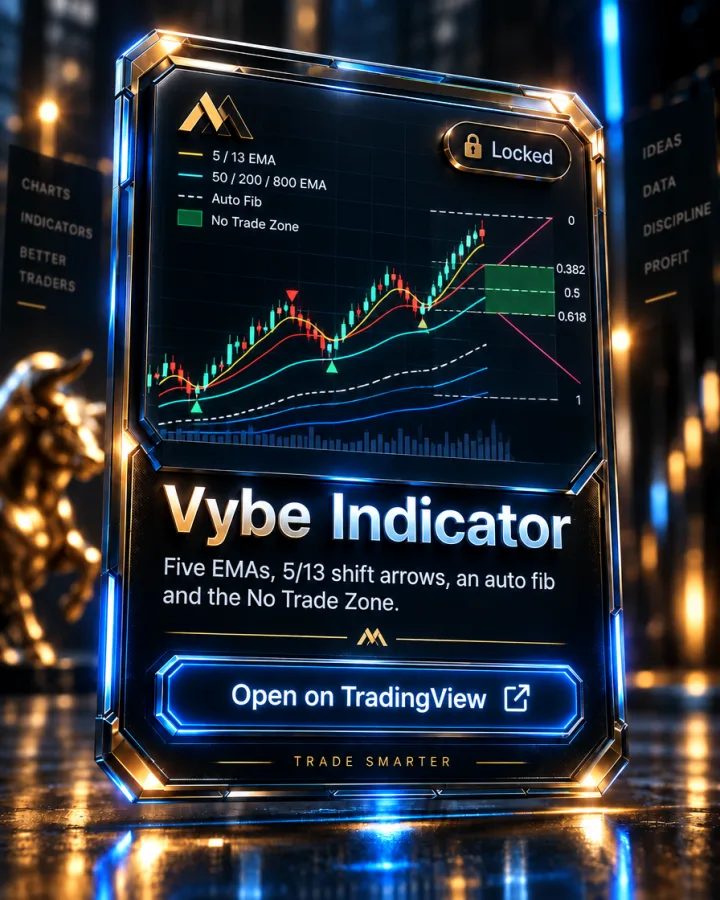
Five EMAs, 5/13 shift arrows, an auto fib on the latest move and the No Trade Zone, in one indicator.
What it shows
Vybe Indicator is the rebuild of the original 2021 Vybe. It puts four things on one chart: the five EMAs from Matrix EMAS (5 yellow, 13 red, 50 aqua, 200 white, 800 blue), shift arrows, an auto fib, and the No Trade Zone.
A shift is a cross of the 5 and 13 EMA, read with the same logic as the Matrix Shift Indicator. Its arrow is drawn only once the candle that made the cross has closed, so it never repaints: green for a buy shift, red for a sell shift. An optional setting turns the arrows gray, and can draw a box, when the 5 and 13 keep crossing inside consolidation; it is off by default.
The auto fib is drawn on the move since the latest shift and redraws as the move extends, instead of waiting for a swing to confirm. Its levels are 0, 0.382, 0.5, 0.618, 0.786, 1, 1.272, -0.27, -0.618 and -0.71, with options to reverse it and to show prices and labels, and an alert fires when a candle closes across a level.
The No Trade Zone is the range built during the Frankfurt open (23:30 to 05:30) and shown from 01:00 to 17:00, with 1x, 2x and 3x projections up and down (4x is optional) and a box showing its width. By default it is hidden when the range is outside 100 to 300 ticks. It now works on every intraday timeframe.
How it's used in the MTM method
The shift arrow is the "The Shift (5 & 13 EMA Cross)" lesson from the EMA Technical Analysis module drawn on the chart, and the 50, 200 and 800 EMAs are the same Aqua, White and Blue lines taught there. Vybe Indicator is the rebuild of the original Vybe, which the TDI & Indicators module covers in its "Vybe Legacy Indicators" lesson; Vybe Legacy stays available as its own indicator. The arrows and the fib mark the picture; the entry, the stop and the exit stay with the trader.
Key features
- Five EMAs in the Matrix EMAS colours: 5 yellow, 13 red, 50 aqua, 200 white, 800 blue
- 5/13 shift arrows drawn once the crossing candle closes (no repainting), with buy and sell alerts
- Optional gray arrows and a box in consolidation, off by default
- Auto fib on the move since the latest shift, redrawn as the move extends, with an alert when a candle closes across a level
- No Trade Zone with 1x, 2x and 3x projections (4x optional) and a width box, on every intraday timeframe
Pairs with
Vybe Legacy
Trend-following 200/800 EMA system with a colour algo for entries and exits.
Matrix Shift Indicator
Shifts and peak formations off the 5 and 13 EMA: M / W setups graded A or B, with SL, Entry, TP1 and TP2 levels and KC exits.
Matrix EMAS
The 5, 13, 50, 200 and 800 EMA ribbon the whole method is built on, each one colour-coded.
How access works
- This indicator is invite-only on TradingView. Access is granted automatically to your TradingView username after you join the Academy — usually within minutes.
- Open the Vybe Indicator script page on TradingView and click "Add to favorite indicators."
- On any chart, open Indicators (the "/" key) → Favorites, and it's there. It's also listed under your Invite-only scripts.
Vybe Indicator is included with every Academy plan — not sold separately
Full Academy access starts at $499, one-time, not a subscription. See full pricing.
FAQ
Is Vybe Indicator the same as Vybe Legacy?
No. Vybe Indicator is the 2021 Vybe rebuilt, with the Matrix Shift Indicator's shift logic and a live auto fib. Vybe Legacy, the 200/800 EMA trend system, stays as its own indicator.
Does it repaint?
The shift arrows do not: each one is drawn only after the candle that made the 5/13 cross has closed. The auto fib is different by design: it redraws as the move since the latest shift extends.
Does it work on every timeframe?
The EMAs, arrows and fib work on any timeframe. The No Trade Zone now works on every intraday timeframe, and only draws when its range is inside the width limits you set (100 to 300 ticks by default).
More questions answered on the full FAQ page.
See the rest of the toolkit on the TradingView Indicators page.
Trading forex and futures involves substantial risk of loss and is not suitable for every investor. Nothing on this page is investment advice. Read the full risk disclosure.