
Matrix Shift Indicator
Shifts and peak formations off the 5 and 13 EMA: M / W setups graded A or B, with SL, Entry, TP1 and TP2 levels and KC exits.
What it shows
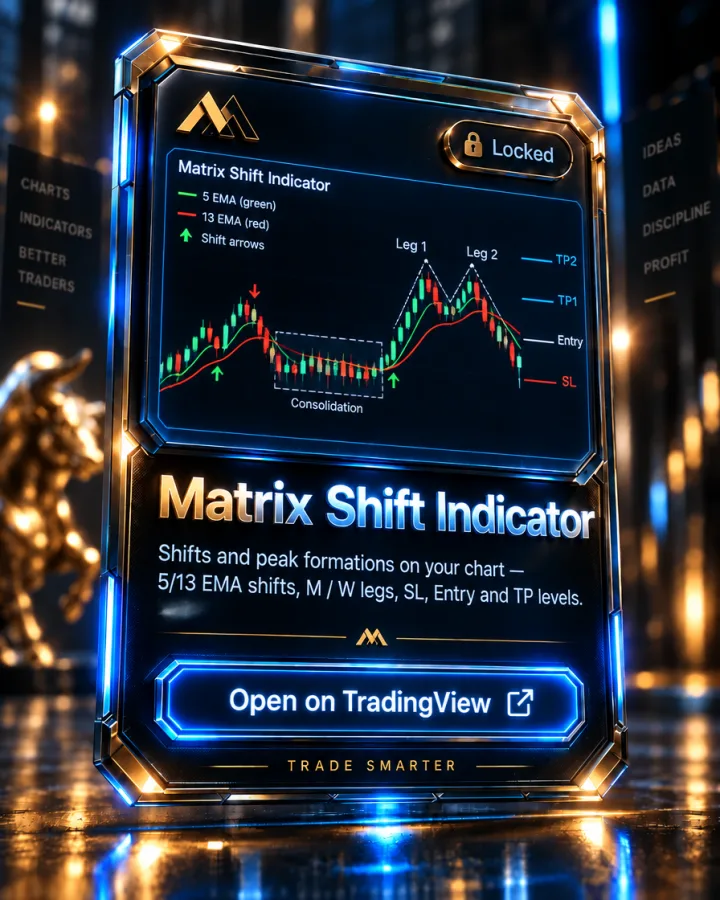
Matrix Shift Indicator puts the Academy's "Shifts and Peak Formations" lesson on your chart. It plots the 5 and 13 EMA and marks every shift (a cross of the two) with a small arrow once the crossing candle closes, so nothing repaints. When the 5 and 13 cross three times within 20 candles, that stretch is boxed as consolidation and its arrows turn gray.
It also finds the M (sell) and W (buy) peak formations. Leg 1 is the first high or low of the trading day and leg 2 is the second, and leg 2 must not take out leg 1 on the close: the golden rule. The shift after leg 2 is the setup. A clean one is grade A. It is grade B, tagged "crisscross" or "chop", when the 5 and 13 crossed between the legs or the formation sits inside consolidation. Grade A setups and regular shifts get SL, Entry, TP1 and TP2 lines with prices: the stop 10 ticks (pips on forex) beyond the peak, the entry at the shift candle's close, and targets at 1R and 2R.
After every shift it marks the lesson's exits: "KC" when a candle body closes back through the 13 EMA against the trade, and the eight-candle rule, "8 ✓" if the trade is in profit after eight candles and "8 ✕" if not. It runs on futures and forex, on any timeframe.
How it's used in the MTM method
This automates the Academy's "Shifts and Peak Formations" lesson: the 5/13 EMA shift from "The Shift" in the EMA Technical Analysis module, the M and W peak formations, the golden rule that leg 2 must not take out leg 1, and the crisscross warning that the market can come back for leg 1 (the stop hunt). The stop 10 ticks beyond the peak and the eight-candle rule are the lesson's own numbers. The 1:2 second target is the Vector lesson's.
Key features
- Plots the 5 and 13 EMA, with an arrow on every shift once the candle closes
- Boxes consolidation (3 crosses in 20 candles) and grays out its shifts
- M / W peak formations with Leg 1 and Leg 2, graded A or B (crisscross or chop)
- SL, Entry, TP1 and TP2 lines with prices and the distance in ticks or pips
- KC exit and the eight-candle rule after every shift
- Alerts for setups, shifts and exits; futures and forex, any timeframe
Pairs with
How access works
- This indicator is invite-only on TradingView. Access is granted automatically to your TradingView username after you join the Academy — usually within minutes.
- Open the Matrix Shift Indicator script page on TradingView and click "Add to favorite indicators."
- On any chart, open Indicators (the "/" key) → Favorites, and it's there. It's also listed under your Invite-only scripts.
Matrix Shift Indicator is included with every Academy plan — not sold separately
Full Academy access starts at $499, one-time, not a subscription. See full pricing.
FAQ
Does it plot the 5 and 13 EMA on my chart?
Yes. The 5 and 13 EMA are on by default, and the 50, 200 and 800 EMA can be switched on in the settings.
Where does it put the stop and the targets?
The stop goes 10 ticks (pips on forex) beyond the peak formation's high or low, the entry is the shift candle's close, and TP1 and TP2 sit at 1R and 2R. Every number is a setting.
When should I exit a trade?
The indicator marks the lesson's two exits: KC, when a candle body closes back through the 13 EMA against you, and the eight-candle rule: if you are not in profit after eight candles, get out.
More questions answered on the full FAQ page.
See the rest of the toolkit on the TradingView Indicators page.
Trading forex and futures involves substantial risk of loss and is not suitable for every investor. Nothing on this page is investment advice. Read the full risk disclosure.