
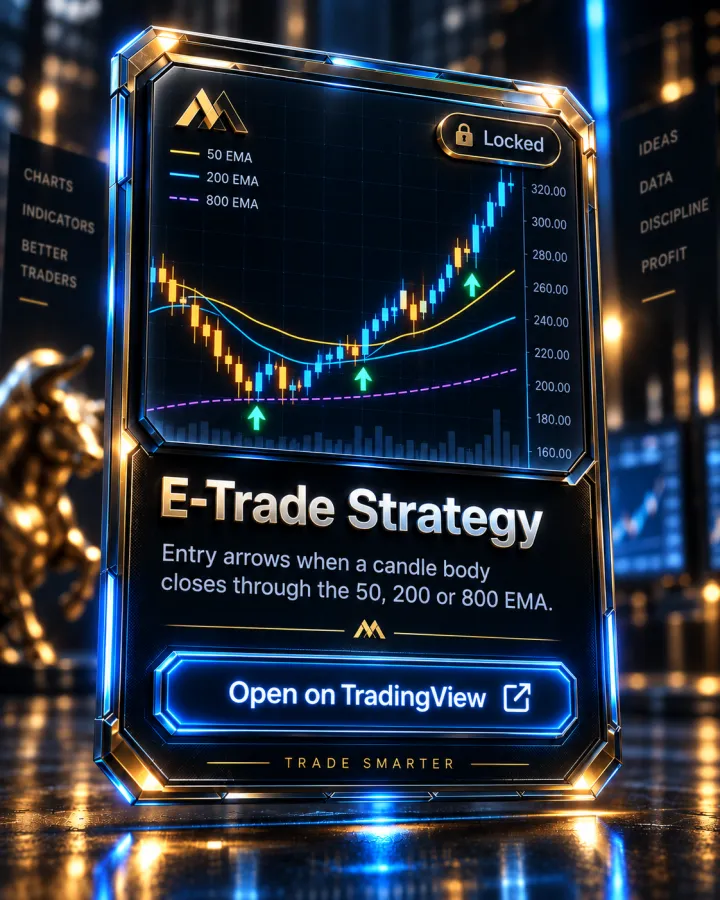
E-Trade Strategy
Entry arrows when a candle body closes through the 50, 200 or 800 EMA.
What it shows
E-Trade Strategy watches the 50, 200 and 800 EMAs and fires a signal the moment a candle body closes through one of them — a green arrow labeled "E" for a close above, a red arrow for a close below. Once a signal fires, it plots a stop loss at 2.0x ATR from entry, a first take-profit at 100 ticks, and a second take-profit at 600 ticks.
The author's own guidance is to enter at market on the candle's close once the arrow appears, and exit at the stop loss, TP1 or TP2 level. It's built for forex and futures, across timeframes from 1-minute to 4-hour, and is designed to work with both trend-following and counter-trend setups.
How it's used in the MTM method
The 50, 200 and 800 EMAs it watches are the same three the curriculum's EMA Technical Analysis module teaches — the Aqua (50), White (200) and Blue (800) — and a candle body closing through a line is exactly the read the "Anatomy of the Japanese Candlestick" lesson teaches (open, high, low, close). The built-in stop and two take-profits (100 and 600 ticks) reflect the same discipline as the curriculum's "Risk-Reward Ratio" lesson, which teaches sizing every trade at 1:2 or higher.
Key features
- Signals on a candle body close through the 50, 200 or 800 EMA
- Green "E" arrow for a bullish close, red arrow for a bearish close
- Auto-plotted stop loss at 2.0x ATR from entry
- Two take-profit targets: TP1 at 100 ticks, TP2 at 600 ticks
- Built for forex and futures, 1-minute to 4-hour timeframes
Pairs with
Matrix EMAS
The 5, 13, 50, 200 and 800 EMA ribbon the whole method is built on, each one colour-coded.
Matrix Swing Trade Strategy
Swing buy and sell signals from the 50 and 200 EMA relationship.
Matrix Shift Indicator
Shifts and peak formations off the 5 and 13 EMA: M / W setups graded A or B, with SL, Entry, TP1 and TP2 levels and KC exits.
How access works
- This indicator is invite-only on TradingView. Access is granted automatically to your TradingView username after you join the Academy — usually within minutes.
- Open the E-Trade Strategy script page on TradingView and click "Add to favorite indicators."
- On any chart, open Indicators (the "/" key) → Favorites, and it's there. It's also listed under your Invite-only scripts.
E-Trade Strategy is included with every Academy plan — not sold separately
Full Academy access starts at $499, one-time, not a subscription. See full pricing.
FAQ
Which EMAs does E-Trade Strategy watch?
The 50, 200 and 800 — the same Aqua, White and Blue lines taught in the Academy's EMA Technical Analysis module.
What counts as a signal?
A candle body closing through one of those three EMAs — not just a wick touch. A close above fires a green "E" arrow; a close below fires a red one, per the script's own description.
Does it set my stop and targets for me?
It plots them automatically once a signal fires — a stop at 2.0x ATR, and take-profits at 100 and 600 ticks — but placing and managing the actual order is still on you.
More questions answered on the full FAQ page.
See the rest of the toolkit on the TradingView Indicators page.
Trading forex and futures involves substantial risk of loss and is not suitable for every investor. Nothing on this page is investment advice. Read the full risk disclosure.