
Matrix EMAS
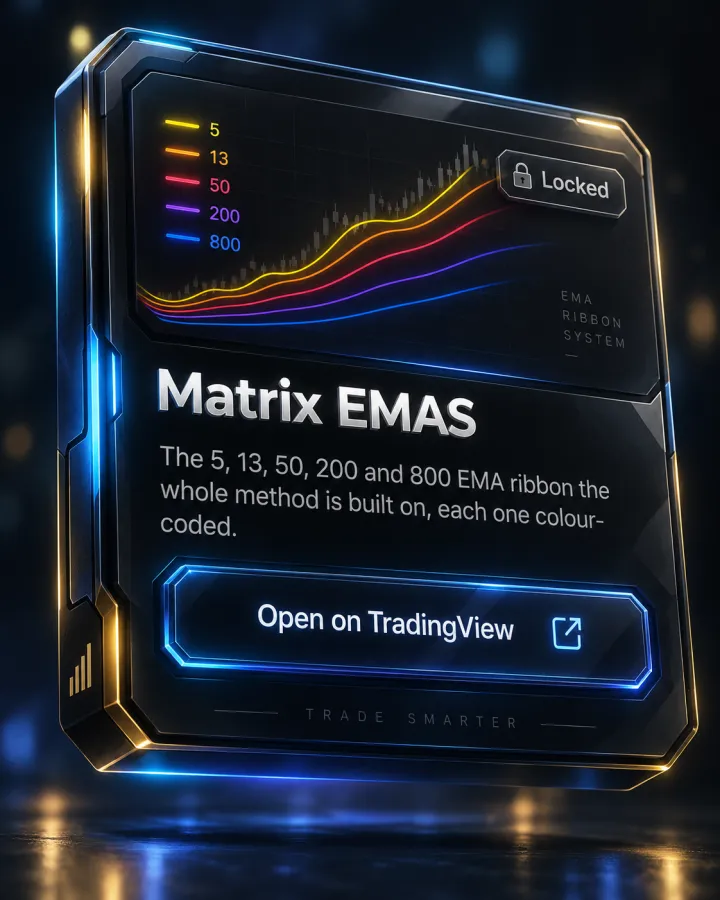
The 5, 13, 50, 200 and 800 EMA ribbon the whole method is built on, each one colour-coded.
What it shows
Matrix EMAS plots five exponential moving averages on your chart in one pass, each rendered in a fixed color so the ribbon reads at a glance: the 5 EMA in yellow, 13 EMA in red, 50 EMA in aqua, 200 EMA (gray by default, switchable to white), and 800 EMA in blue.
It's a charting indicator, not a signal generator — it draws the lines; reading them is the method taught in the curriculum below.
How it's used in the MTM method
This is the EMA ribbon the Academy's EMA Technical Analysis module (level 3) is built around. The curriculum's "Matrix Chart Setup" and "The 5 EMA Settings" lessons walk through installing this exact ribbon with these exact colors — 5 (Yellow), 13 (Red), 50 (Aqua/Water), 200 (White), 800 (Blue) — before moving into trend identification (EMAs stacked above price read as sells, below as buys, bunched together as consolidation).
The 50 EMA gets its own lesson — "The Aqua" — on the idea that price constantly returns to it, and the 800 EMA anchors the "Blue Waves" lesson in the Risk Management module, which reads its wave structure for macro trend context. The 5/13 relationship is also what the Matrix Shift Indicator (below) automates as a crossover signal.
Key features
- Five EMAs plotted at once: 5 (yellow), 13 (red), 20 (orange), 50 (aqua), 800 (blue)
- 200 EMA defaults to gray with an input option to switch it to white
- Fixed color coding, so the ribbon reads the same on every chart and timeframe
Pairs with
Matrix Shift Indicator
Shifts and peak formations off the 5 and 13 EMA: M / W setups graded A or B, with SL, Entry, TP1 and TP2 levels and KC exits.
Matrix TDI Indicator
Traders Dynamic Index — RSI, volatility bands and a signal line in one pane.
Matrix Session Break
Asia, London and New York session ranges, with buy/sell stop levels and three take-profit targets.
How access works
- This indicator is invite-only on TradingView. Access is granted automatically to your TradingView username after you join the Academy — usually within minutes.
- Open the Matrix EMAS script page on TradingView and click "Add to favorite indicators."
- On any chart, open Indicators (the "/" key) → Favorites, and it's there. It's also listed under your Invite-only scripts.
Matrix EMAS is included with every Academy plan — not sold separately
Full Academy access starts at $499, one-time, not a subscription. See full pricing.
FAQ
Do I need to configure the colors myself?
No — the ribbon ships with the colors already set (5 Yellow, 13 Red, 50 Aqua, 200 White/gray, 800 Blue), the same colors the curriculum's EMA lessons teach against.
Is this a buy/sell signal indicator?
No — it plots the five EMAs only. Reading trend direction and entries from the ribbon is what the Academy's EMA Technical Analysis module teaches; the Matrix Shift Indicator and Matrix Swing Trade Strategy below automate specific EMA-based signals.
Does it work on futures as well as forex?
Yes — the curriculum's Futures Trading module has a dedicated lesson on applying the Matrix EMA system to futures like ES, NQ and YM with contract-specific settings.
More questions answered on the full FAQ page.
See the rest of the toolkit on the TradingView Indicators page.
Trading forex and futures involves substantial risk of loss and is not suitable for every investor. Nothing on this page is investment advice. Read the full risk disclosure.