
Matrix TDI Indicator
Traders Dynamic Index — RSI, volatility bands and a signal line in one pane.
What it shows
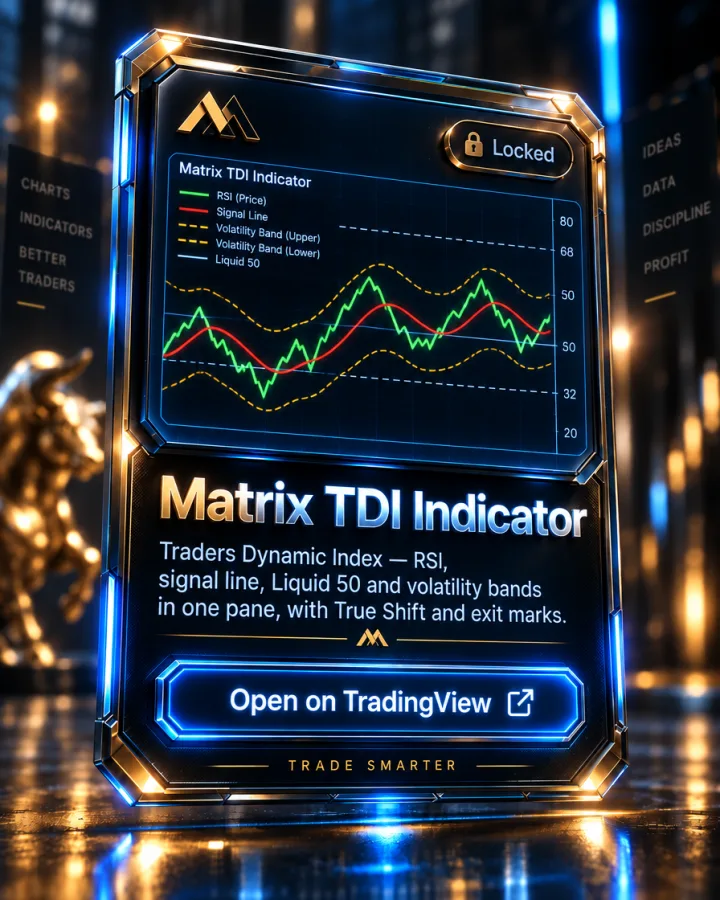
Matrix TDI Indicator combines RSI, two moving averages of the RSI, and volatility bands into a single lower-pane indicator. RSI measures momentum on a 0–100 scale, flagging overbought above 70 and oversold below 30. A fast moving average (2 bars) tracks immediate momentum against a slow moving average (7 bars) for the longer-term trend, both plotted on the RSI. Volatility bands, built the same way as Bollinger Bands but from RSI standard deviation, plot an upper and lower band around a 50 midline.
Per the script's own description, a buy signal is read when the fast line crosses above the midline or the upper band; a sell signal is the mirror case crossing below. Band width widens and narrows with volatility, and the page also references 40/60 pullback zones either side of the 50 equilibrium line.
How it's used in the MTM method
This is the TDI the Academy's TDI & Indicators module (level 4) is built around. The curriculum's own names for these same lines are RSI (Green), Signal/TSI (Red), Liquid 50 (Yellow) and Volatility Bands (Blue) — the "TDI Basics" lesson teaches them under those labels. From there the module builds up specific setups this indicator's readout feeds: "SFBW" (Shark Fin Blood in Water, when RSI leaves the volatility band and TSI surfaces), "Power50" (a high-probability setup from TDI super-extremes back to the 4H Aqua), the "Escape (ESC)" exit, and "TDI Rejections" at the volatility band boundaries.
Key features
- RSI plotted on a 0–100 scale, overbought/oversold at 70/30
- Fast (2-bar) and slow (7-bar) moving averages of the RSI
- Volatility bands built from RSI standard deviation around a 50 midline
- Buy/sell reads on fast-line crosses of the midline or bands
- 40/60 pullback zones referenced either side of the 50 equilibrium
Pairs with
Matrix EMAS
The 5, 13, 50, 200 and 800 EMA ribbon the whole method is built on, each one colour-coded.
Vybe Legacy
Trend-following 200/800 EMA system with a colour algo for entries and exits.
Matrix Shift Indicator
Shifts and peak formations off the 5 and 13 EMA: M / W setups graded A or B, with SL, Entry, TP1 and TP2 levels and KC exits.
How access works
- This indicator is invite-only on TradingView. Access is granted automatically to your TradingView username after you join the Academy — usually within minutes.
- Open the Matrix TDI Indicator script page on TradingView and click "Add to favorite indicators."
- On any chart, open Indicators (the "/" key) → Favorites, and it's there. It's also listed under your Invite-only scripts.
Matrix TDI Indicator is included with every Academy plan — not sold separately
Full Academy access starts at $499, one-time, not a subscription. See full pricing.
FAQ
What do the curriculum's TDI names map to?
The Academy's EMA-course names for these same lines are RSI (Green), Signal/TSI (Red), Liquid 50 (Yellow) and Volatility Bands (Blue) — taught in the "TDI Basics" lesson of the TDI & Indicators module.
What is Power50?
A curriculum setup that reads a TDI super-extreme back to the 4-hour Aqua (50 EMA) as a high-probability trade — covered in the TDI & Indicators module.
Is TDI a standalone strategy?
The Academy teaches it alongside the EMA ribbon and price action, not on its own — the curriculum's SFBW, Power50, Escape and Rejection lessons all reference EMA context as well as the TDI reading.
More questions answered on the full FAQ page.
See the rest of the toolkit on the TradingView Indicators page.
Trading forex and futures involves substantial risk of loss and is not suitable for every investor. Nothing on this page is investment advice. Read the full risk disclosure.