
Matrix Top Down Analysis
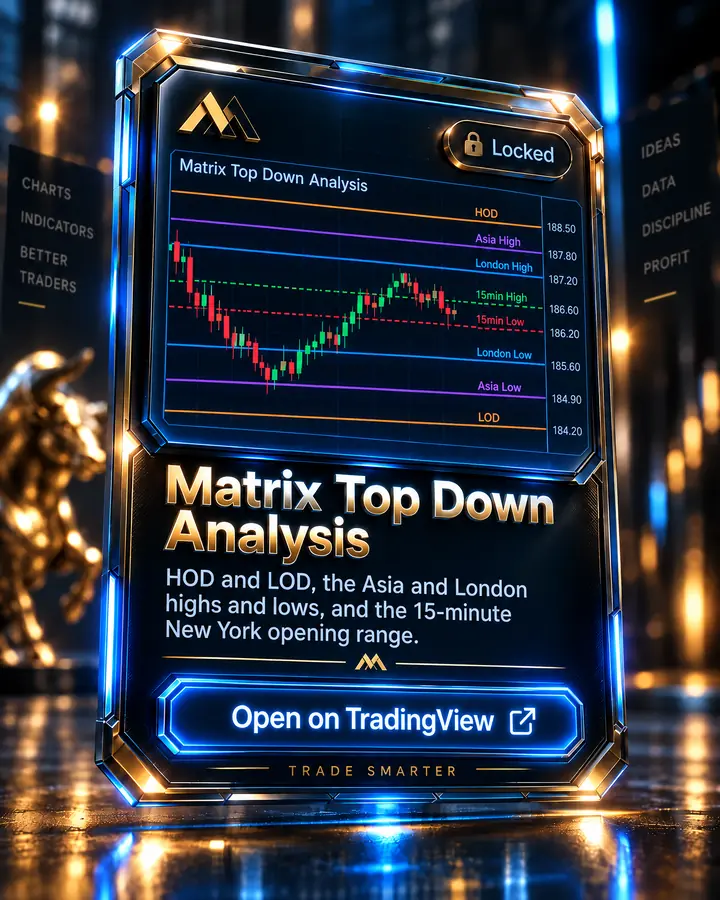
HOD and LOD, the Asia and London highs and lows, and the 15-minute New York opening range.
What it shows
Matrix Top Down Analysis draws the levels a New York open trader would otherwise mark by hand every morning, and keeps them live: the high and low of the trading day (HOD and LOD), the Asia session high and low (18:00 to 02:00 New York time), the London session high and low (02:00 to 08:30), and the 15-minute opening range — the high and low of the 09:30 to 09:45 candle.
A level whose session is still running moves with price; once the session ends it stays fixed. The opening-range lines follow the forming 09:30 candle and lock when it closes at 09:45, so nothing has to be dragged. Every level is a price the chart has already traded, so nothing is predicted and nothing repaints. It's an indicator only — it marks levels and doesn't print buy or sell signals or place orders.
How it's used in the MTM method
The sessions it marks are the Asian, London and New York sessions taught in the curriculum's "Trading Session Times" lesson (Market Foundations module), and its Asia High and Low frame the Asian range covered in "The A-Range" lesson. Drawing those session highs and lows every morning is the "Identifying Key Levels" lesson from the same module, done for you. The session times are editable, so they can be matched to the windows taught in the lessons.
Key features
- HOD and LOD for the current trading day, on the exchange's own trading day (18:00 ET for CME futures)
- Asia and London session highs and lows, updated live while each session runs
- 15-minute New York opening range (09:30–09:45) that locks when the candle closes, with an optional midpoint
- Correct opening range on any intraday timeframe; levels switch off on daily charts with a note explaining why
- Nearby levels share one label so text never overlaps; up to 30 days of history
- Every session time, colour, line style and label size is editable; all eight values appear in the Data Window
Pairs with
Matrix Session Break
Asia, London and New York session ranges, with buy/sell stop levels and three take-profit targets.
Matrix EMAS
The 5, 13, 50, 200 and 800 EMA ribbon the whole method is built on, each one colour-coded.
Matrix News Indicator
CPI, jobs report and FOMC built in, plus your own events: a live countdown panel, shock candles and news-range breaks, with alerts.
50% Matrix
Liquidity sweep, a two-candle fib and the 50% entry, with a stop loss and two take-profits.
How access works
- This indicator is invite-only on TradingView. Access is granted automatically to your TradingView username after you join the Academy — usually within minutes.
- Open the Matrix Top Down Analysis script page on TradingView and click "Add to favorite indicators."
- On any chart, open Indicators (the "/" key) → Favorites, and it's there. It's also listed under your Invite-only scripts.
Matrix Top Down Analysis is included with every Academy plan — not sold separately
Full Academy access starts at $499, one-time, not a subscription. See full pricing.
FAQ
Which levels does it draw?
Eight: HOD and LOD for the trading day, Asia High and Low, London High and Low, and the 15min High and Low of the New York opening range (09:30 to 09:45 New York time).
Does it repaint or give signals?
No. Every level is a price the chart has already traded, and a level stops moving once its session ends. It marks levels only — it doesn't print buy or sell signals or place orders.
Why are the Asia and London lines missing on my chart?
Those sessions trade overnight, so the chart needs extended trading hours turned on. The indicator shows a note in the corner when it can't see overnight candles. The levels are also off on daily and higher timeframes — use a minute chart.
More questions answered on the full FAQ page.
See the rest of the toolkit on the TradingView Indicators page.
Trading forex and futures involves substantial risk of loss and is not suitable for every investor. Nothing on this page is investment advice. Read the full risk disclosure.